
The wealth classification most often used in household survey-based equity analyses is based on an asset index created through principal components analysis (Filmer and Pritchett, 2001), accounting for differences in the importance of assets between urban and rural households. The variables used to calculate the score include household assets (e.g., cookstove, bicycle and car), building materials of the house (e.g., wood floor, brick walls and corrugated roof) and access to utilities (e.g., sanitation and electricity). The score is provided with the original survey datasets and calculated according to a standard methodology (Rutstein, 2008; Rutstein and Johnson, 2004). The households in the surveys are ranked according to the resulting score and split into five or ten equally sized groups (quintiles or deciles). This is a very common and useful approach but has an important limitation – it is a relative classification of wealth. It will work with a given survey, but when working with multiple surveys, the poorest group in one country may be actually wealthier than the intermediate or even the richest group in another country. Therefore, this approach may be suitable for looking at how much disadvantage the poorest in each country are subjected to, but it does not allow for an assessment of the impact of wealth on coverage of health interventions.
The attribution of absolute income, in international dollar values to household groups will allow the comparison of similar levels of wealth across countries and assess how much different countries can offer in terms of health for a given level of wealth. We have estimated the absolute income for countries’ wealth groups (wealth deciles, for instance) according to the methods described in a recent paper (Fink et al., 2017) where the income is estimated using data on GDP, income concentration and an assumption of income being distributed according to a log-normal distribution.
In summary, the income distribution for each country is estimated by using the consumption share of the country’s gross domestic product (GDP) and the Gini coefficient to generate the parameters for a log-normal distribution (Harttgen and Vollmer, 2013; Lopez and Serven, 2006). This allows the estimation of average absolute income in dollars for each decile of the population (or any other percentile of interest). Next, the households in the survey sample are ranked by the asset index, and all households in each wealth decile are assigned the dollar value corresponding to the same decile of the income distribution. Income is expressed in constant 2011 international dollars adjusted at purchasing power parity. Below is an example of how this can be used for analysis. The figure shows the composite coverage index (CCI, a weighted average of eight RMNCH key indicators) for selected countries with a very low income for their poorest quintile. We can see that some countries fare way better in terms of CCI coverage at comparable levels of income (Barros et al., 2020).
In this page it possible to download the estimated absolute income for quintiles and deciles for countries with a DHS or MICS survey.
We also make available an example dataset with absolute income and coverage with births attended by a skilled provider for Egypt and Bangladesh.
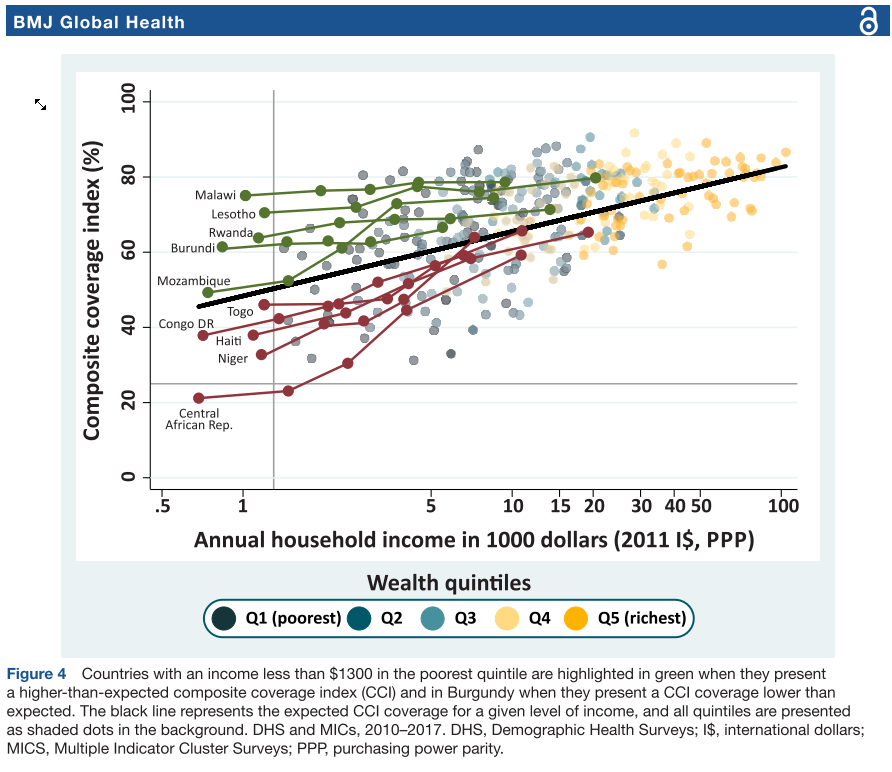 Composite coverage index by absolute income in several low- and middle-income countries
References
Barros AJD, Wehrmeister FC, Ferreira LZ, Vidaletti LP, Hosseinpoor AR, Victora CG. Are the poorest poor being left behind? Estimating global inequalities in reproductive, maternal, newborn and child health. BMJ Glob Heal 2020;5:1–9. https://doi.org/10.1136/bmjgh-2019-002229.
Filmer D, Pritchett LH. Estimating Wealth Effects without Expenditure Data-or Tears: An Application to Educational Enrollments in States of India. Demography 2001;38:115. https://doi.org/10.2307/3088292.
Fink G, Victora CG, Harttgen K, Vollmer S, Vidaletti LP, Barros AJD. Measuring Socioeconomic Inequalities With Predicted Absolute Incomes Rather Than Wealth Quintiles: A Comparative Assessment Using Child Stunting Data From National Surveys. Am J Public Health 2017;107:550–5. https://doi.org/10.2105/AJPH.2017.303657.
Harttgen K, Vollmer S. Using an asset index to simulate household income. Econ Lett 2013;121:257–62. https://doi.org/10.1016/j.econlet.2013.08.014.
Lopez JH, Serven L. A Normal Relationship? Poverty, Growth, and Inequality. World Bank Policy Res Work Pap 2006:1–31. https://doi.org/10.1596/1813-9450-3814.
Rutstein S. The DHS: Approaches for Rural and Urban Areas. DHS Work Pap Ser 2008:1–22.
Rutstein SO, Johnson K. The DHS wealth index. DHS Comparative Reports No. 6. Calverton (MD): ORC Macro; 2004 2004.