


» Provides periodically updated analyses to the WHO's Global Health Observatory Health Equity Monitor. It includes periodic statistical analyses of data from health surveys conducted worldwide to detect and monitor health inequalities.
» Acts as a Collaborating Center to the Countdown to 2015 Initiative monitoring advances in maternal, newborn and child health (http://www.countdown2015mnch.org/), drafting 3-year reports on socioeconomic, ethnicity, urban-rural and gender inequalities for 68 countries with high mortality rates, including Brazil. This initiative is joined by several international agencies (WHO, UNICEF, UNFPA), bilateral development agencies, and non-governmental organizations and academic institutions, including UFPel. UFPel was one of the founding members of the Countdown to 2015 Initiative in 2005.
» Conducts and assists research and epidemiological studies on specific aspects of health inequalities in Brazil and worldwide, especially in projects developed at Johns Hopkins University and London School of Hygiene and Tropical Medicine.
In 2012, with the purpose of advising the Ministry of Health about technical aspects of monitoring and evaluation of health inequalities, the ICEH conducted several analyzes on Equity in Health in Brazil, using a selection of indicators extracted from the National Demographic and Health Survey (PNDS 2006/07). We are providing acesss to the full technical report.
In our quest to improve the presentation of equity data, we explored several different alternatives to compare absolute inequality between interventions, countries, or even time trends, and the one of choice is the “equiplot”. It presents intervention coverage by groups, making it possible to “see” both the level of coverage in each group and the distance between groups, which represents absolute inequality. We present two examples of equiplots, one by area of residence, the other by wealth quintiles. In both cases, we can see that under-five mortality decreased in Bangladesh from 1993 to 2011 for all subgroups. The distance between urban and rural and between the poorest and richest quintiles clearly decreased across time. These graphs make it easy for non-specialists to grasp the idea of trends in inequalities. We have also developed a Stata code that allows for anyone using this package to produce this type of graph quickly and without hassle. The command allows the user to choose the order of the Y axis, to change the scale of the X axis, the size of the dots, and uses the variable labels for the legend. The code is available freely, with instructions and an example dataset.
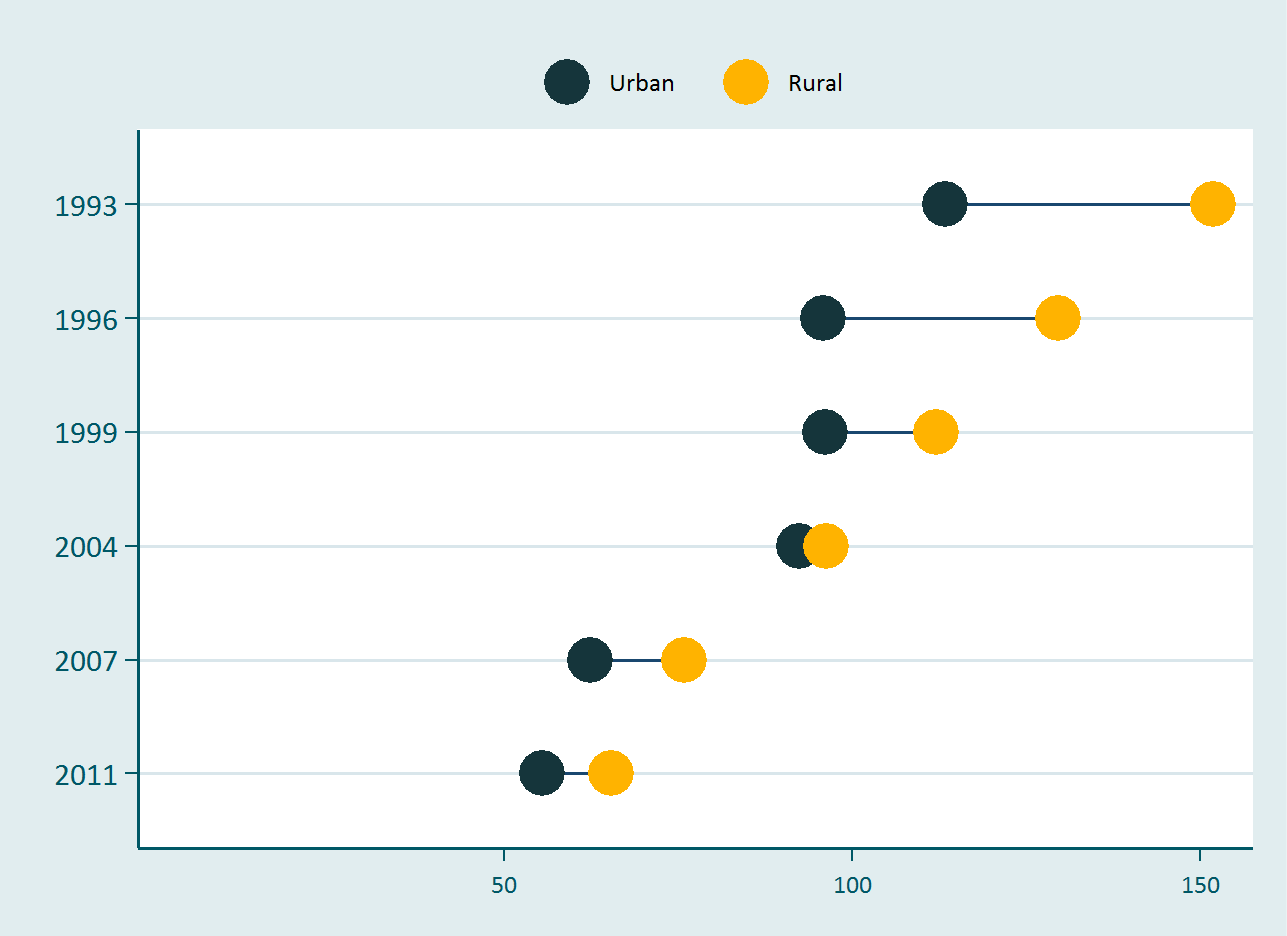 Figure 1 - Under-five mortality rates in Bangladesh, by area of residence. (Data source: Bangladesh DHS 1993-2011)
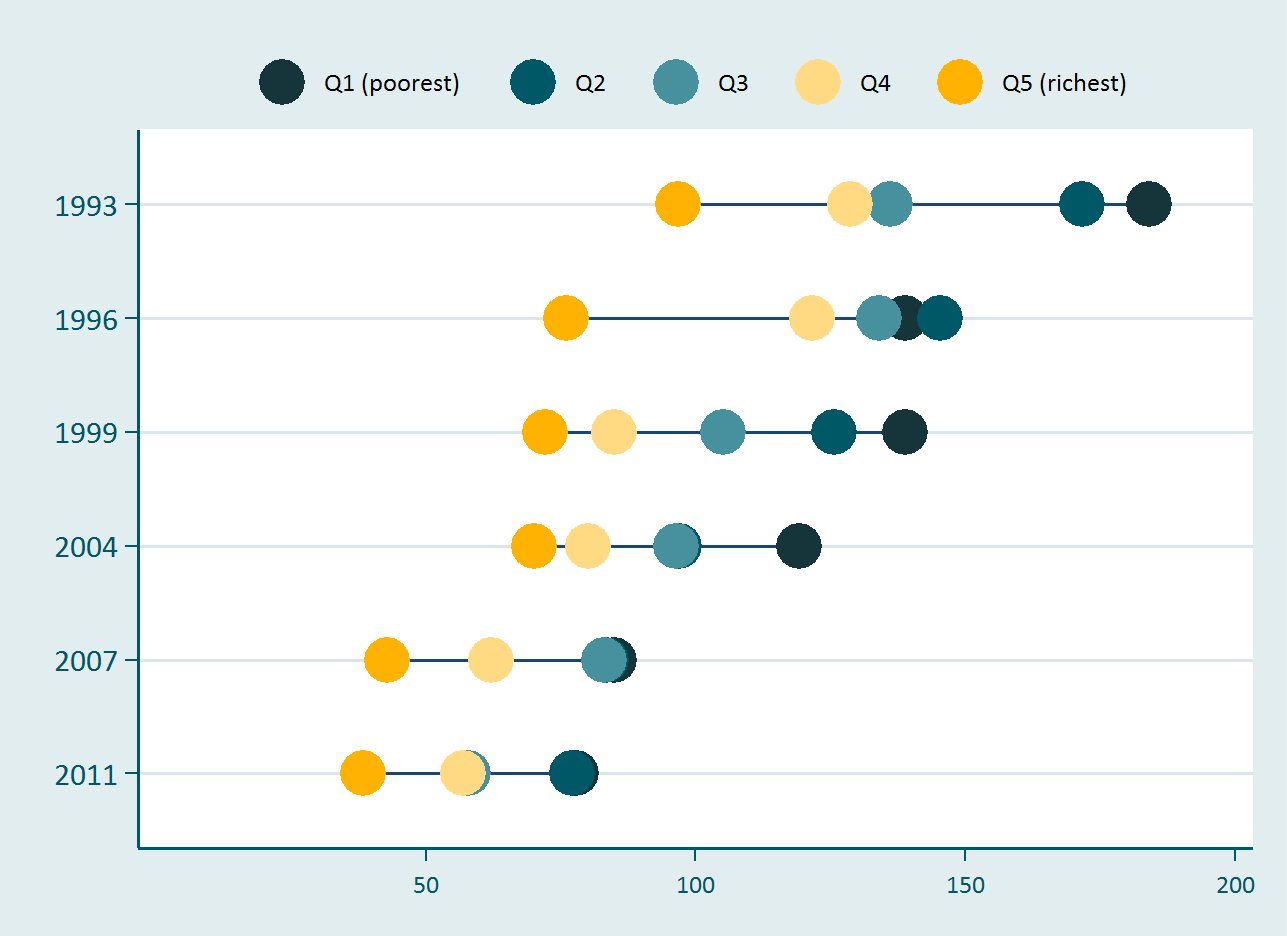 Figure 2 - Under-five mortality rates in Bangladesh, by wealth quintiles. (Data source: Bangladesh DHS 1993-2011)
You can install the equiplot ado-file for Stata by typing:
net install equiplot, from("https://www.equidade.org/files")or download the ado-file clicking here. You can also download a short guide of how to use the equiplot command clicking here.
The equiplot is now available in R as part of the ICEHmeasures package, available on CRAN. To download the package, please type:
install.packages("ICEHmeasures")